
Your Airbnb Vacation Rental Listing strategy is critical.
We wanted to improve the way you access data from your vacation rental pricing strategy. We racked our brains to design the most efficient and user-friendly interface that we could. And so the Performance Dashboard was born!
Hot on the heels of our Markets launch, our users can now enjoy the brand new Performance Dashboard. Here, you’ll find all of the insights you need to make informed business decisions for your Airbnb listing.
As local market data experts, we know the kinds of insights that offer value to Airbnb hosts. Remember, we were founded by a group of real estate investors and experienced Airbnb hosts! Our insights offer real financial rewards when used correctly, and we’re here to guide you through the entire process!
Optimize Your Airbnb Vacation Rental Listing with DPGO!
Performance Dashboard Features
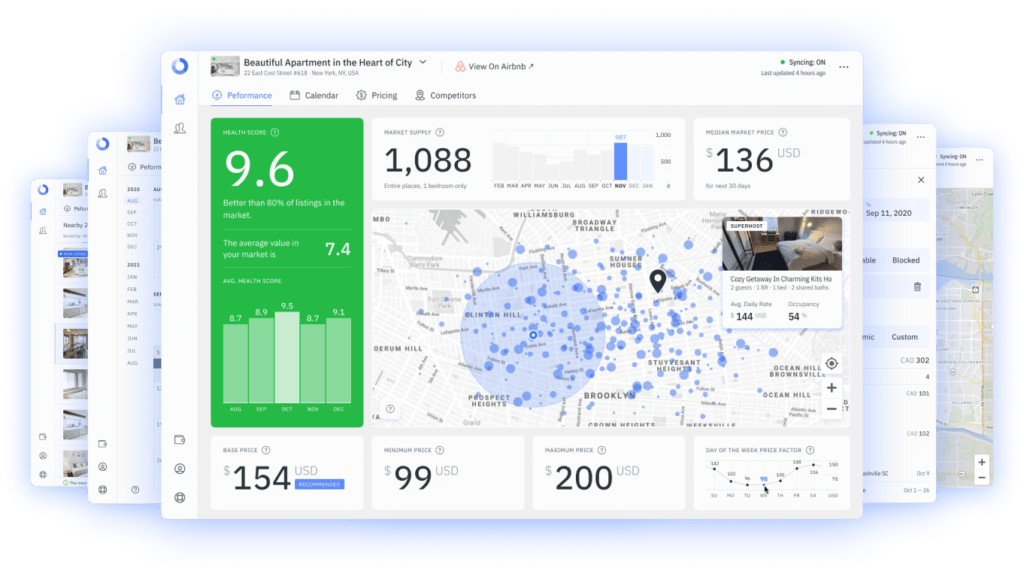
Map
Our map shows you where your competitor listings are located, in relation to your own. Zoom in or out to learn more about the alternative options that Airbnb users are presented with.
Airbnb Vacation Rental Listing Health Score
Not only does our Health Score block display your current Health Score, but it also shows all of your previous ones! You can track your Health Score for two months prior, as well as a forecast of two months ahead. You can also see the average Health Score in your local area to ascertain how well you’re doing in comparison to your closest competitors.
Market Supply
The ‘Market Supply’ block shows you how many Airbnb listings are active in your area. These figures are specific to your listing type, and you can even see how many active listings there were per month from the months prior.
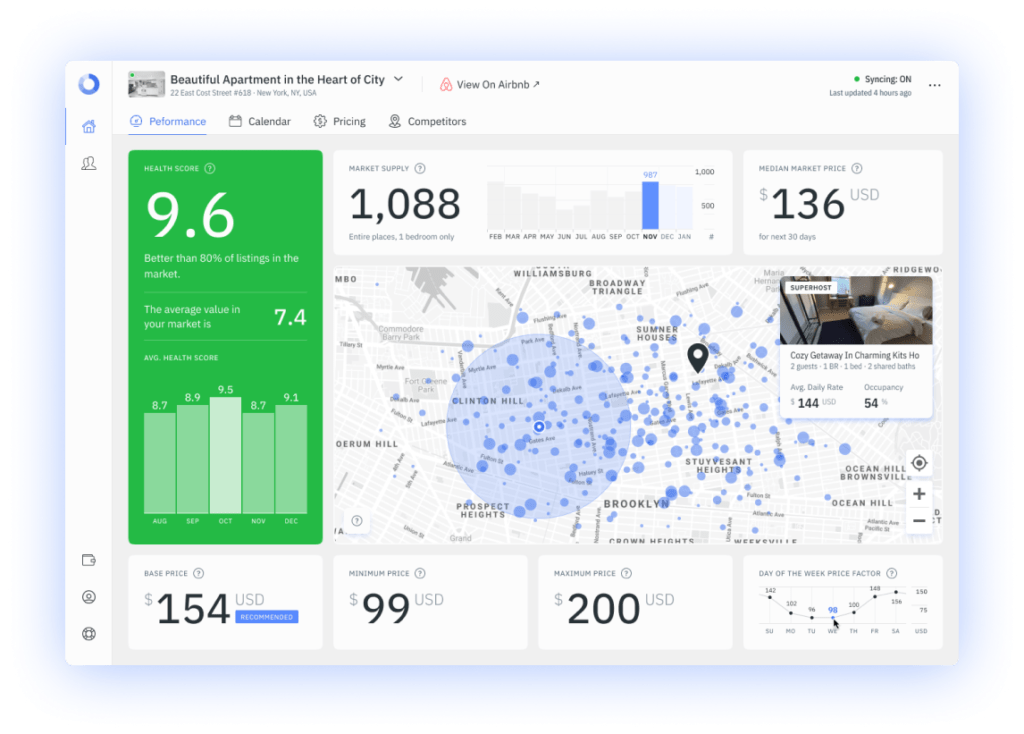
Median Market Price
The Median Market Price will help you understand the local norm for properties that are similar to yours. By gaining these vital insights, you can identify for yourself where your property fits into the vacation rental market in your area. Knowing how your listing fits will help you market your listing better, optimize your vacation rental pricing, and perfect your guest experience approach.
Base, Minimum, and Maximum Price
We wanted to make sure that all of your information was easily accessible to you. This is why we designed these pricing blocks to display your three most important pricing figures: base, minimum, and maximum.
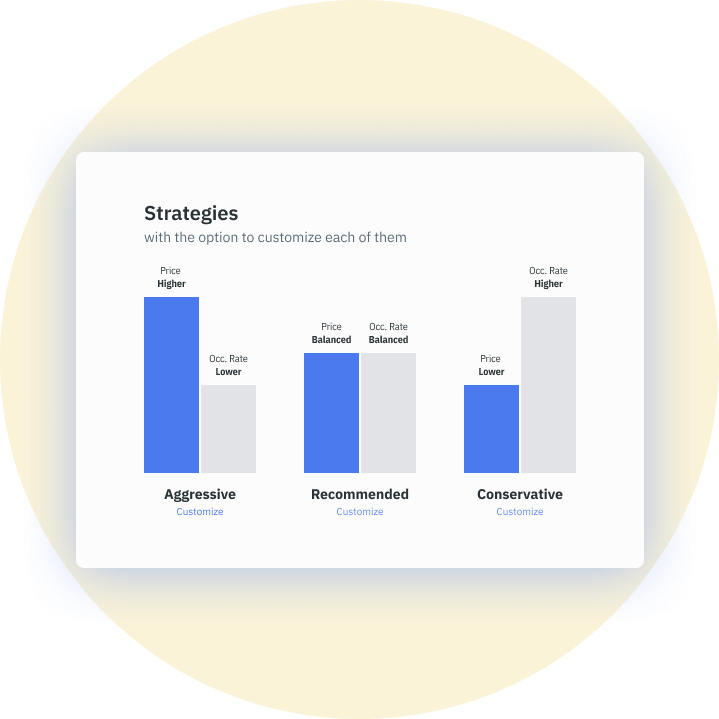
These pricing values for the base of your pricing strategy and will help you decide on your Airbnb vacation rental listing price. You input values that you are comfortable with, and our algorithm develops a unique pricing strategy to work within that pricing framework. If, after a few weeks, you are not seeing the desired results, have a look at our recommended values and recalibrate. We want you to get the very most out of your Airbnb listings, and we’re always here to help!
Day of the Week Price Factor
Most experienced Airbnb hosts know that their rates should vary from season to season and day to day. Your listing price on a Monday should not be the same as your listing price on a weekend. If it is, you are missing out on valuable income.
Our Day of the Week Pricing Factor displays the predicted price of your listing, broken down into the day of the week. These pricing predictions are made on the market environment as it stands, and these values do change.
Nightly Rates
Our Nightly Rates graph shows a whole host of data and insights.
This graph shows you a 52-week forecast of your listing’s rates. So you can isolate which price insights you’d like to see by selecting or deselecting the price sections on the right-hand side of the graph. Your choices of pricing insights include dynamic price, current price, and median booked price. As well as a minimum price, maximum price, and average market price.
You can choose to view values in the 25th, 50th, and 75th percentile to see the variations in market trends that are active in your locale.
Analyze Your Airbnb Vacation Rental Listing with DPGO!
We packed as much information on how to optimize your Airbnb vacation rental listing price into the Performance Dashboard as we could, and our users are loving the experience so far! Want to join DPGO too and optimize your Airbnb listings with in-depth market data?

Comments are closed.