
Analyzing Airbnb data is not just about browsing through active listings; it’s a deep dive into the complexities of Airbnb analytics, which can significantly impact the profitability of Airbnb properties and vacation rentals. As big data experts, we understand how challenging it can be to extract meaningful summary information from short-term rental properties’ performance.
That’s why we’re here to assist! Our data specialists have dedicated their efforts to developing the latest DPGO feature: Markets. This tool is designed to make all the difference for both seasoned and novice hosts. Whether you’re a DPGO user or not, you’re invited to visit our homepage, where you can find a selection of free insights tailored to your local market.
The most significant challenge reported by Airbnb hosts is the lack of access to key Airbnb data and using it to increase occupancy rates of their Airbnb listings. Many hosts have expressed frustrations over their inability to effectively analyze Airbnb analytics to make their Airbnb properties more profitable. To address this issue, we developed DPGO Markets to provide essential Airbnb data at no cost, including an Airbnb calculator and market research tools.
By focusing on main Airbnb rental hubs across the US and Canada, we’ve established a solid foundation for superior Airbnb data analysis by hosts. This initiative aims to improve the management and performance of their investment properties and vacation rentals. While we have reserved some of the more intricate data structures for DPGO users, non-users can still access a wide range of vital data.
How Do I Work Markets by DPGO?
Let’s embark on the initial step: inputting your postcode or town name. As of this writing, we span several thousand markets in the US, Canada, Australia, and Mexico, encompassing a diverse array of short-term rental properties, Airbnb listings, and vacation rentals.
Each day, Team DPGO commits tirelessly to expanding our coverage, ensuring we include data from different markets to assist Airbnb hosts in making their listings more profitable. To stay abreast of our growing coverage and gain insights into making your Airbnb or vacation rental property more profitable, we recommend following us on Facebook (@dpgo.software).
After entering your town name or postcode, you will be directed to the Markets homepage specific to your county. To provide a comprehensive view of your area and its potential as an investment property or short-term rental, we’ve also incorporated links to neighboring county homepages. This feature is particularly useful for conducting market research and comparing different markets to understand where your property stands in terms of occupancy rate and profitability.
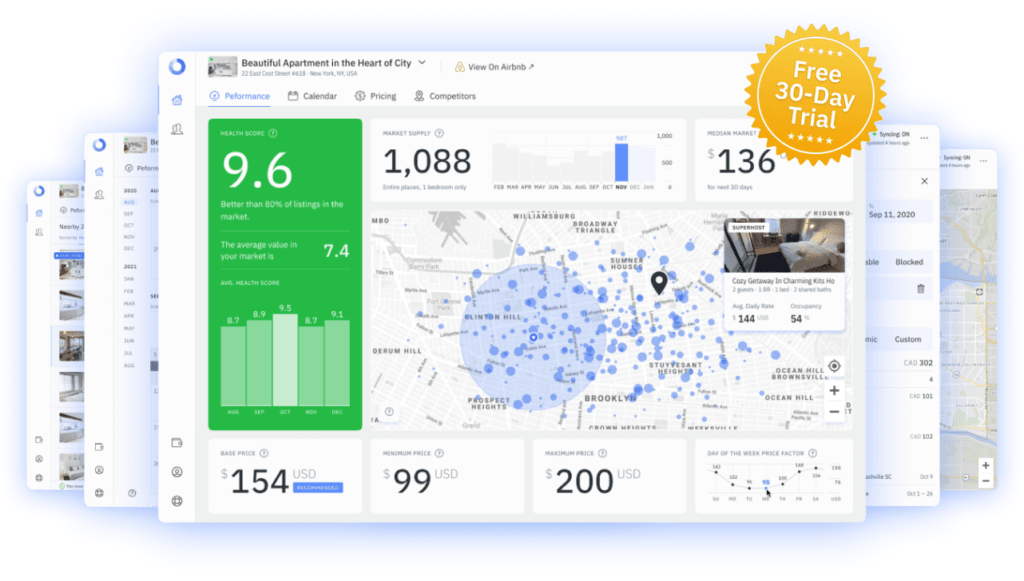
Upon arriving at the homepage, you will see the eight distinct data blocks. These blocks offer a range of metrics and summary information to enhance your understanding of your local Airbnb and short-term rental market. The data, presented in the clearest and most logical format possible, includes key insights into Airbnb listings, occupancy rates, average nightly rates, and more.
Each data block has a clear label, allowing you to quickly assess the performance of your vacation rental or investment property against others in the same market. Additionally, you can use our Airbnb calculator, integrated within the data blocks, to forecast earnings and manage your listings more effectively. This comprehensive set of tools and metrics will guide you through optimizing your short-term rentals for higher profitability and success in the competitive Airbnb market.

What Does Markets Show Me?
The market area-specific homepages show you eight data blocks. More specifically, these data blocks show you:
-
Market Supply – the number of active listings in your area.
-
Average Daily Rate – the average rate from all the listings in your area.
-
Occupancy Rate – the average occupancy rate in your local market
-
Bookings – the total number of confirmed bookings in your area over the last 30 days.
-
Day of the Week Occupancy Rate – the average occupancy rate of your local market, broken down into daily percentages.
-
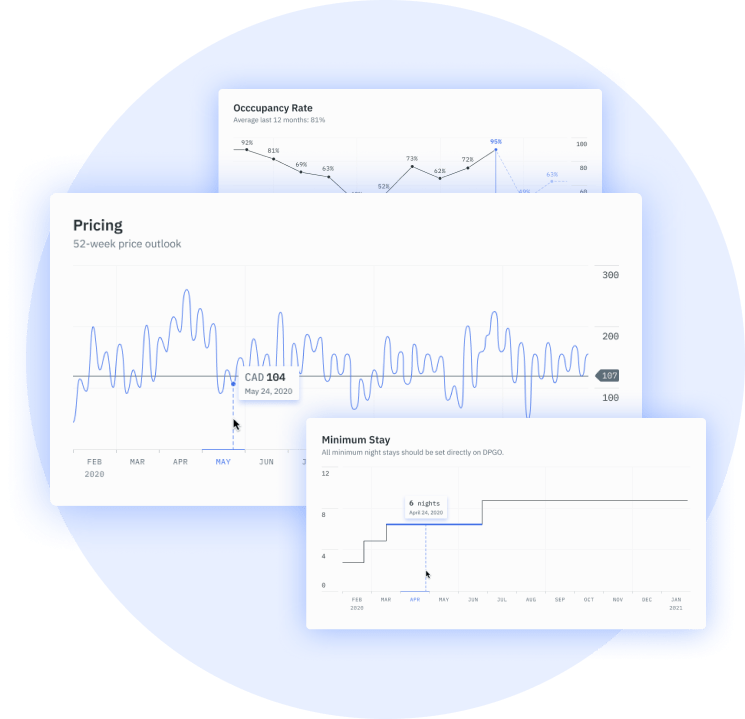
Day of the Week Price Factor – the daily rate, broken down by day of the week, in your market from the last 28 days.
-
Market Trends – this graph shows the 75th, 50th, and 25th percentile of your 52-week predicted average daily rate.
-
Map – the map block shows you exactly where your competitor properties are located.
How Can I Use the Airbnb Data in Markets?
These free market insights were designed to give you more information on the trends and booking surges in your local area. By knowing who your competitors are, you can better optimize your property to attract as many bookings as possible.
Knowing exactly where these competitor listings are located also helps optimize your Airbnb earnings. Once you have a better understanding of your target market, you can begin to anticipate their wants and needs and compete directly with those listings closest to you to win those bookings.
The Day of the Week Price Factor helps you identify when the listings in your market are increasing their prices, and when they are decreasing them. You can use this information to match their listing price fluctuations, while also offering a greater discount for your guests.
If your occupancy rate does not match that of your greater local area, you have some work to do. It means you’ve set probably too high prices, or your listing is not advanced with your target guest in mind. Somewhere along the line, you are missing the mark.
The Average Daily Rate figure should match yours relatively closely. Unless, of course, your property is marketed to a different type of guest. However, this figure is not useless to you if your listing is unique in the market. Rather look at this as a benchmark by which you need to measure your pricing index.

What Airbnb Data Does Markets Not Show Me?
We couldn’t give away all the good stuff for free, so we decided to offer up a selection of the critical Airbnb data that we source. You can use the insights on the free Markets page to perfect your Airbnb approach. As you’ll notice on the Markets homepage for your specific area, there are more data blocks, but only DPGO users have access to these insights.
Namely, these insights include more in-depth competitor analysis, market revenue, Health Score (and how it relates to the average Health Score of your local market), average minimum price, average maximum price, and average base price. We also include insights into dynamic prices, historical prices, and pricing ranges, as well as market trends and live links to your competitor’s Airbnb listing pages.
We also included competitor Health Scores so you can see how your listing measures up to the rest of the local market. Airbnb data and analysis is our specialty. We put many long hours into developing Markets, and we hope that you can see the value that we can offer your Airbnb listing business.
To learn more about DPGO, you can visit our website at www.dpgo.com, check us out on Facebook (@dpgo.software), or visit our YouTube channel for helpful tutorials and explanation videos. You can also contact us at any time if you need help or if you’d like to ask us a few questions.
We’d love to hear from you! You either email us at support@dpgo.com or join the Support Chat via our homepage. Check out a few of our other posts! We recently did an explanation post on Travel Trends 2021, and another post on how to use them to increase your booking rates!


2 Comments
Pingback: How to Become an Airbnb Entrepreneur - 2021 Guide - Hi Boox
Pingback: How to Make Money on Vacation Home Rentals