
The vacation rental market is a volatile place. Details Airbnb data insights show that markets can change drastically every week. One week a market is booming, the next hosts are pulling their listings – it just all depends on the market environment and the popularity of that particular period.
With the United States’ international borders remaining mostly closed to the world, the local short-term rental market will have to continue to exist on business from local travelers. The American and Canadian short-term rental market is also aided by the fact that travel between the two countries is open!
In light of this, we wanted to take a look at the biggest market shifts over the last two weeks. Primarily, we noticed that most changes are in the number of listing on the market. We made sure to check the occupancy rates in the areas concerned, just to help you make a bit more sense of these numbers!

Biggest Total Airbnb Listing Change 2021 (Week 30-31 2021)
10. El Dorado, California
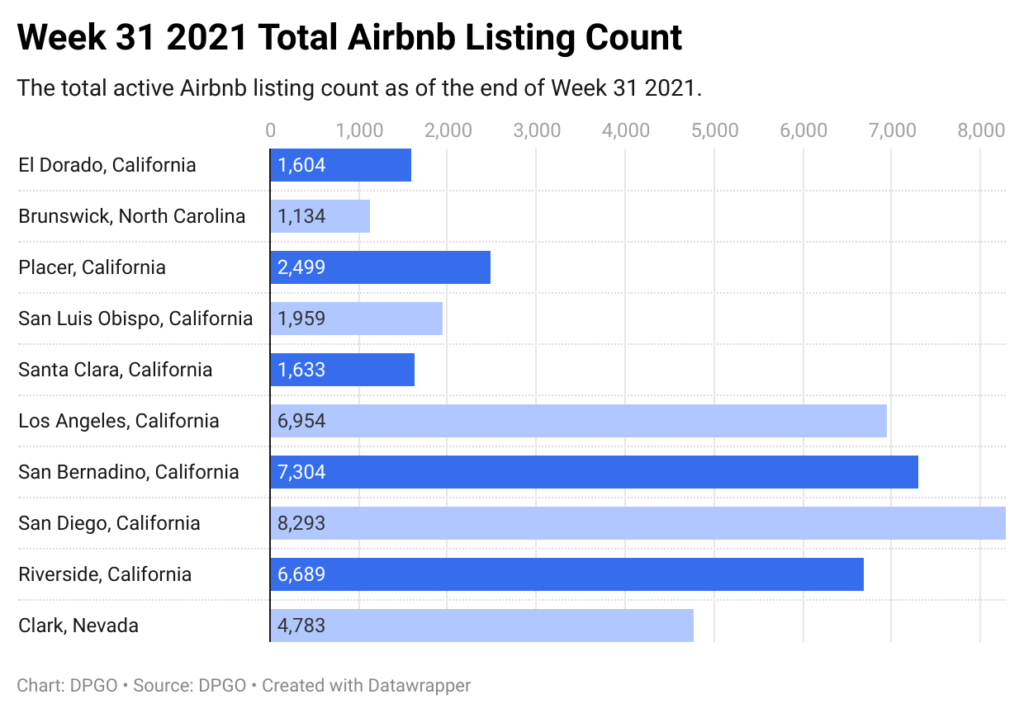
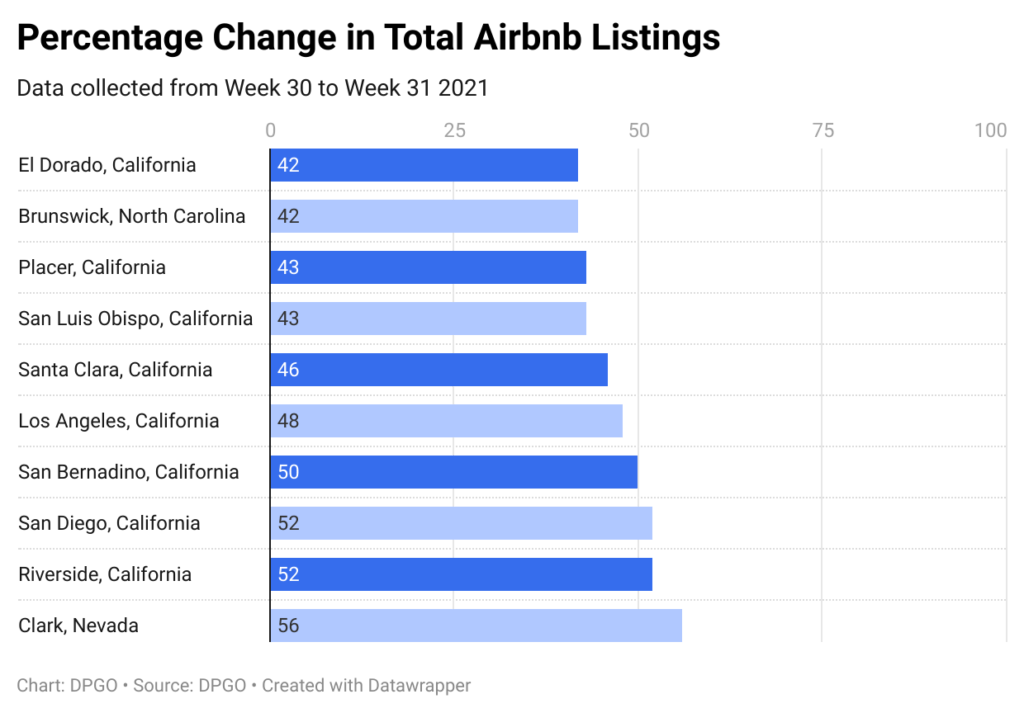
In the space of just one week, El Dorado, California went from 1,129 properties listed on Airbnb in Week 30. In Week 31, El Dorado California had 1,604 properties listed on Airbnb. That’s an increase of 42%. The occupancy rate in the area is currently sitting at 58%. The area sees most of its bookings on a Friday and a Saturday, with the market boasting a majority two-night minimum stay requirement. El Dorado has an average daily rate of $381.
9. Brunswick, North Carolina
At the start of Week 30, Brunswick had 797 active listings, according to our Airbnb data. At the end of Week 31, that number of active Airbnb listings had increased to 1,134. That’s an increase of 42%. The occupancy rate in the Brunswick area is currently sitting at 66%. The area sees the majority of b bookings from Thursday to Saturday, with Tuesday being the least popular day. A majority of 38% of active listings in the area have set a 3-night minimum stay requirement. The average daily rate in Brunswick is $203.
8. Placer, California
From Week 30 to Week 31, Placer, California saw a listing increase of 43%. That corresponds to an increase from 1,717 to 2,499 in just 13 days. The majority of listings have opted for a two-night minimum (49%). The occupancy rate in the Placer market is 53%. The most popular days in this market are Friday and Saturday. The average daily rate in Placer is $393.
7. San Luis Obispo, California
The average occupancy rate in San Luis Obispo, California is 62% and the average daily rate is $280. In Week 30, the market had a total of 1,367 active listings, according to our Airbnb data. In Week 31, that number had increased by 43% to 1,959 total listings. A majority of 48% of hosts in the area have set their minimum stay requirement at 2 nights minimum. Once again, Friday and Saturday nights are the most popular nights in this market, which continues the weekend getaway trend!

6. Santa Clara, California
Santa Clara saw a total Airbnb listing increase of 46%, from 1,121 in Week 30 to 1,633 in Week 31. The average daily rate in Santa Clara is $117 and the average occupancy rate is 51%. The most popular days are Wednesday, Friday and Saturday. In this market, 28% of hosts have set a minimum night stay requirement of one night, and 21% of hosts have opted for a two-night minimum stay, and another 21% of hosts have set a 30-day minimum stay requirement.
5. Los Angeles, California
In Week 30, Los Angeles had 4,687. At the end of Week 31, Los Angeles had 6,954 active listings. This represents an increase of 48%. The average occupancy rate in the market is 53% and the average daily rate is slightly lower than you might expect at $161. A majority of 47% of hosts have opted to set their minimum stay requirements at 30+ days. The most popular days are Wednesday through Saturday.
Wow, this is a California-heavy list!
4. San Bernadino, California
San Bernardino hosts enjoy an average occupancy of 36%, which is relatively low, but their average daily rate is $224. In Week 30, the active Airbnb listing total in San Bernardino stood at 4,879 and that rocketed by 50% to 7,304 at the end of Week 31! The most popular day is Saturday. Most hosts in San Bernadino, 59% to be exact, have opted to set their minimum stay requirement at a two-night minimum.
3. San Diego, California
In Week 30, San Diego had 5,465 active Airbnb listings. In Week 31, San Diego had 8,293 listings. This represents a 52% shift in just 13 days! The average daily rate is $225 and the average occupancy rate is 62%. The most popular days in this market are Friday and Saturday. Minimum stay requirements of one, two, and three nights are most popular with 20%, 29%, and 24%.
2. Riverside, California
Riverside, California saw a change of a total listing count from 4,388 to 6,689. That’s an increase of 52%! The most popular minimum night stay requirement in Riverside is two nights. The average daily rate is $276 and the average occupancy rate is 39%. The most popular nights in Riverside are Friday and Saturday.
And coming in at number one is… (it’s not in California!).
1. Clark, Nevada
Well, I bet you thought it would be a Californian city! Well, Nevada pulled a sneaky one! Clark, Nevada had a Week 30 total of 3,058. Then in Week 31, that number went up by 56% to 4,783. The average occupancy rate in the area is 50% and the average daily rate is $178. The most popular days are Friday and Saturday, and most hosts have opted for a two-night minimum stay (33%).
That rounds up our list this week! If you’re interested in receiving more Airbnb data insights from DPGO, you can sign up for our monthly newsletter or visit our dedicated insight page, Markets by DPGO. Simply enter your postcode, click ‘Get Insights’, and you’re on your way to free optimization tools!


2 Comments
Pingback: People are booking Christmas vacations earlier than ever before - DUK News
Pingback: Best Vacation Rental Markets: The Best Place To Buy A Vacation Home