
We love our Performance Dashboard. It took rounds of development to get it to where it is today. We consistently receive great feedback from our users about the Performance Dashboard and the amount of data displays that we’ve included.
When we originally launched the Performance Dashboard in December of 2020, we crafted a blog post explaining the main features and how you as the user can read the assortment of graphs that we included. You can view the original post here.
This week on the DPGO blog, we wanted to dive a little deeper into the extended insights that we feature in our Performance Dashboard. As a company, we are always looking for ways to improve and our beloved Performance Dashboard is no exception.
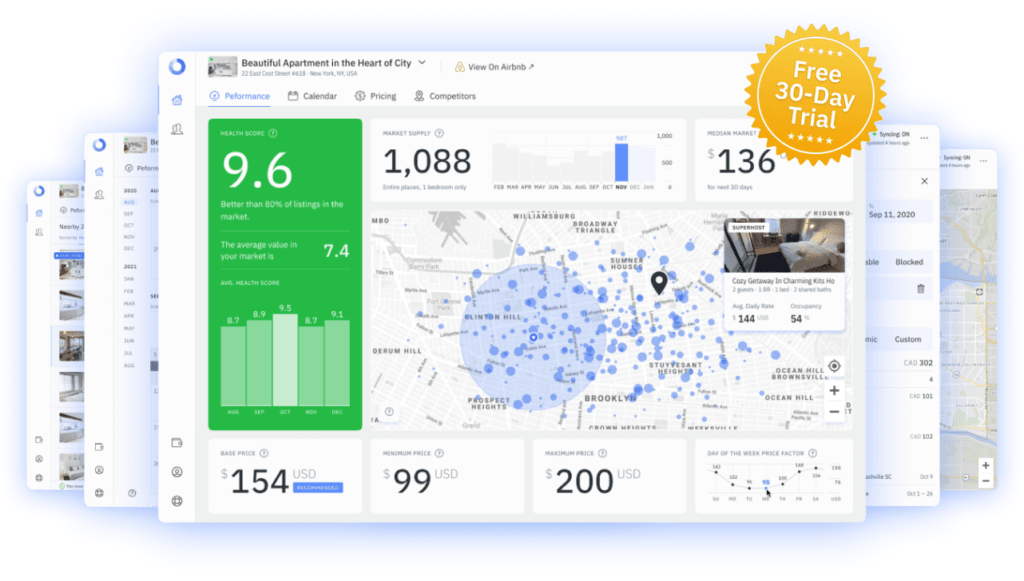
In that first blog post, we covered our map, Health Score, Market Supply, Median Market Price, Base, Minimum, and Maximum Price widgets. Plus, we looked at the Day of the Week Price Factor and Nightly Rates to help our users optimize the running of their short-term rental listings.
In this post, we’ll explore the following widgets – Market Rental Size, Market Rental Type, Average Price, Average Daily Rate, and Base Number of Guests. Over the next two weeks, we’ll post more features like this one, with all of the widgets in the Performance Dashboard!
It’s also important to remember that we’ve also included comments that are specific to your listing which will give you insight into how your listing compares to the market and how you can use the data to your advantage!
Performance Dashboard Widgets Continued…
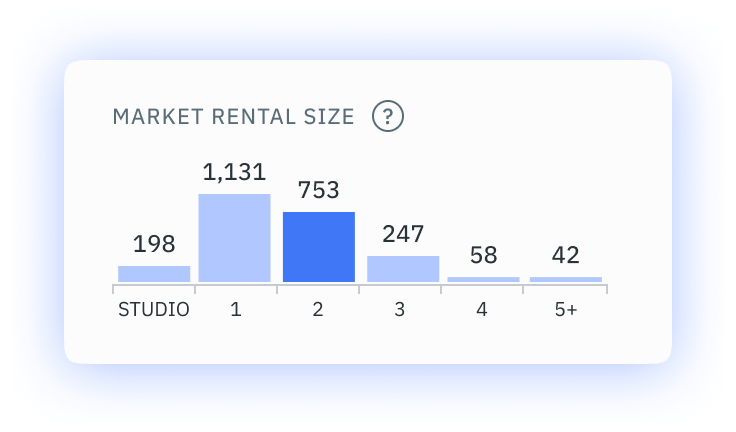
Market Rental Size
In this widget, we look at how your local market is divided in terms of rental property types. We’ve only included ‘Entire Property’ stats in this widget but it shows you which type of property is the most common in your market. The widget is divided into the following types of Airbnb property: Studio, 1, 2, 3, 4, and 5+ bedroom properties. You can use this information to understand which properties are most popular in your local area. Pre-existing business owners will already know which properties get them the most bookings. You can also use this data to bolster your business approach and opt instead to buy or let a property that is less common in the market.
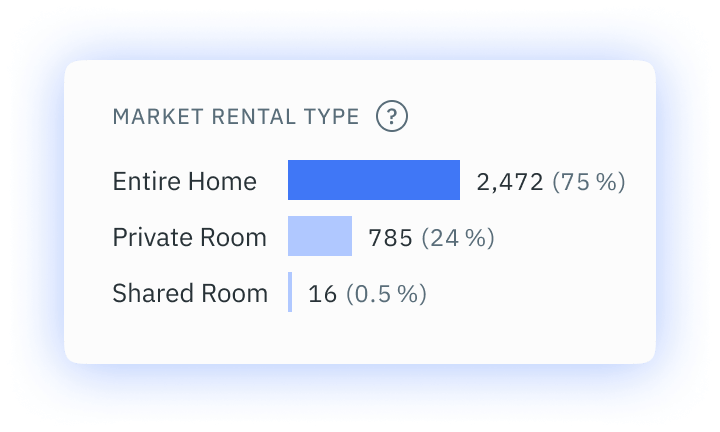
Market Rental Type
The Market Rental Type tells you the distribution of the market according to listing classification. The three classifications are Entire Home, Private Room, or Shared Room. Again, this shows which types of rentals are the most popular with hosts and therefore with guests too. It can also show gaps in the market and give you a competitive advantage because you’ve been able to identify this gap!
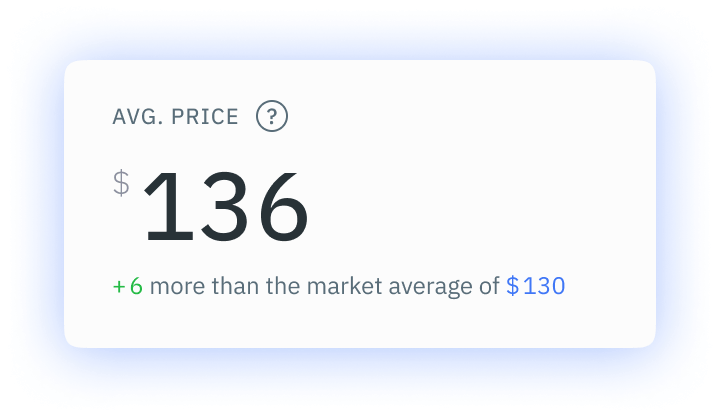
Average Price
We analyze the price of your competitor listings over the next 30 days and create an average to give you a screenshot of how your market is looking in the next month. With every widget, we only use data from your direct competitors, which we determine by comparing the classification and configuration of the listing property. So if you own a two-bedroom apartment, we will only compare your property to other two-bedroom apartments in the local area. You can use this information to determine your price and see if you need to make adjustments!
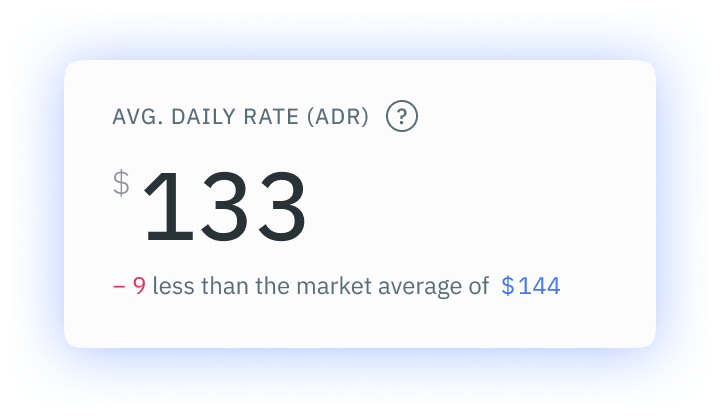
Average Daily Rate
While the Average Daily Rate (ADR) sounds very similar to the Average Price, there are some differences. While Average Price takes an average of the prices in your market for the next 30 days, the ADR looks at the data from confirmed bookings and the prices that were paid for those properties in the 30 days previously.
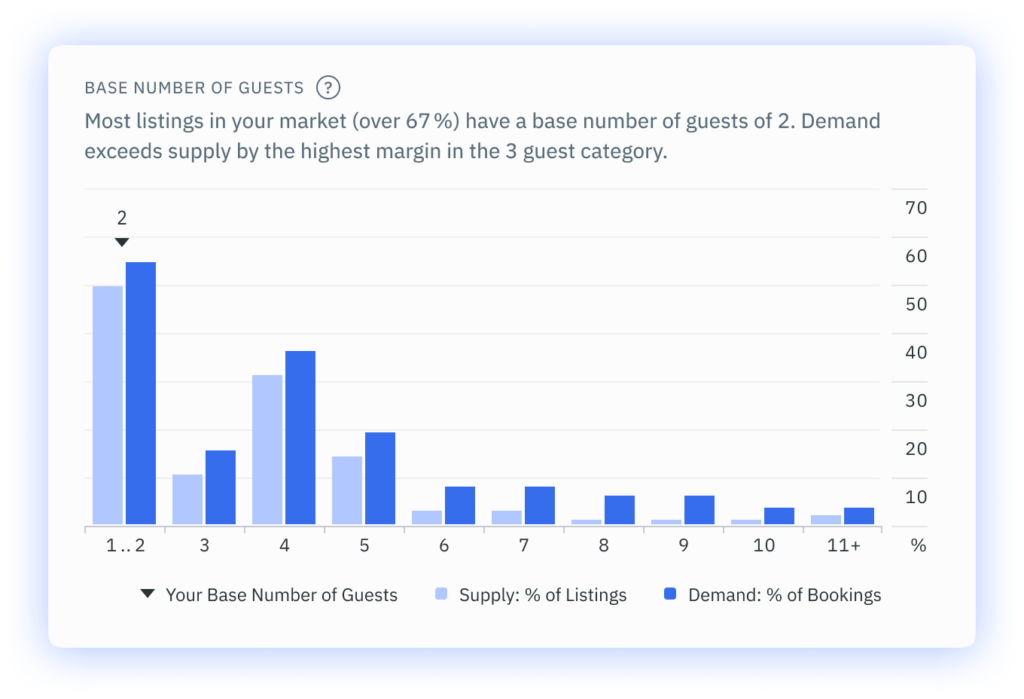
Base Number of Guests
With our projection of travel trends in 2022 including family travel, the base number of guests included in the booking is an important consideration. Guests want to know that, if they want to include six people in their traveling party, it won’t cost an arm and a leg in extra person fees! The graph shows both supply and demand. If the demand is higher than the supply in your local market, then it indicates an unmet need within the booking public. In short, this will show you a niche in the market and you can use this information to exploit it!
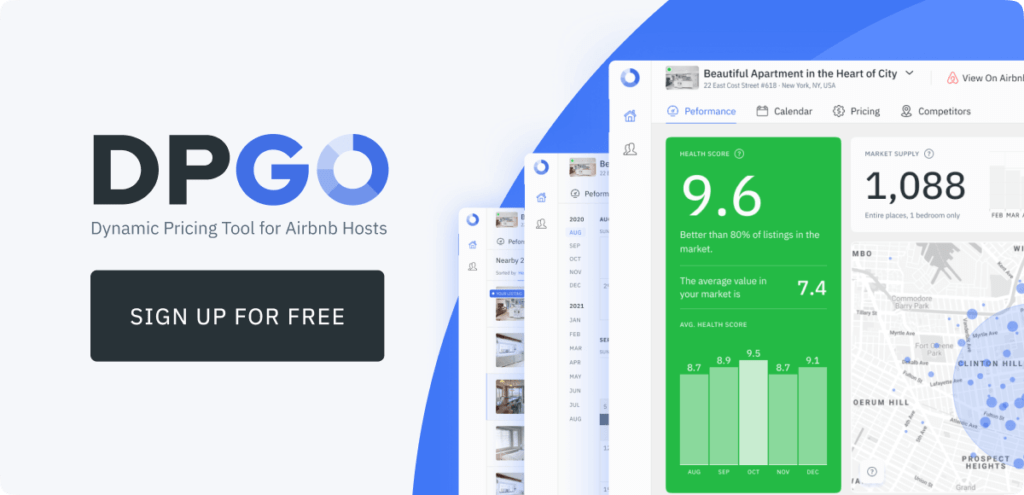
How Can I Access the DPGO Performance Dashboard?
Sign up for DPGO now by clicking on the banner below and creating your account! We have a range of payment options, and a few free features too, plus a free 30-day trial to help you experience the effects for yourself!

Comments are closed.