
February is a difficult month for short-term rental hosts and managers. After the industry unrest caused by the pandemic, experts predicted that February 2021 would be one of the worst-performing months of the last few years. We dived into the data, and here is what we found…
We don’t know where those “experts” got their numbers! Because it’s certainly not what we saw in our February data insights. Like we did in January, we wanted to look back at the Airbnb industry’s top 10 performing markets. But, unlike the blog post we did back in January, this month we wanted to take a look at something different. We are looking not at the best overall performing markets, but the ones that displayed the greatest positive change.
We divided the data into more digestible sections, namely occupancy rate, average daily rate, and total room count.
Top 10 Most Improved – Occupancy Rate Data
As you know by now, Airbnb has embarked on a serious marketing campaign to expand its host network. This campaign started at the start of the year. It’s too early to tell whether this campaign has been a success or not. But we isolated the ten most improved counties according to occupancy rates. We compared February and March of this year to show you how the market fluctuates every month.
We did our best to scope out why each of these areas saw such a change in occupancy rate. Remember, February is a slow month in the short-term rental industry. By March of each year, most people are ready for a break, and these smaller, mostly rural counties are the perfect choice for an escape!
Airbnb occupancy rates fluctuate for several reasons, including seasonal demand changes, optimization of listings, hosts using dynamic pricing, and even smaller considerations like events or gatherings.
Top 10 Most Improved – Average Daily Rate Data
Pricing is a complex topic. Prices can, and should, change on a monthly, even weekly, basis. These price fluctuations keep revenue optimized and ensure that your STR business is running as profitably as possible. This list of the top 10 largest price fluctuations between February and March 2021. It shows you how drastically prices can change in the space of four short weeks.
The changes in pricing can be put down to several things. Said fluctuations include changes in levels of demand, hosts choosing to price dynamically, and large events in the area. Also, digital nomads opting to “work from anywhere”, seasonal changes, and historical pricing trends also affect pricing.
Top 10 Most Improved – Total Room Count Data
As we previously stated, Airbnb has been focusing its efforts on expanding its host network. This section is proof that it’s working, at least in some places. The below counties saw the largest increase in the total number of listings between February and March 2021. We decided not to break it down into individual listing types, because we wanted to shine the attention on the local market growth in each of these areas.
We have a few ideas as to why the number of listings increased by the percentages below, and these include festive period building delays, increased booking interest, large-scale local investment, development of new attractions, relaxing of travel restrictions, financial incentives from local tourism bodies, and changes in local STR legislation.
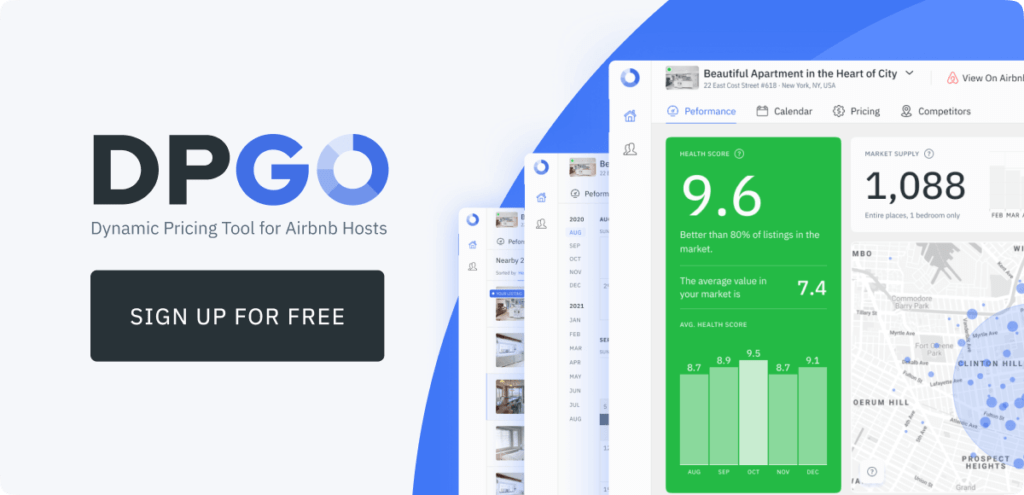
Get More Insights from DPGO
We’re experts in local market data, and we know the industry better than most. As our team is made up of experienced Airbnb hosts and real estate investors, we know exactly the type of insights that hosts need to optimize their earnings and maximize their occupancy rates.
Our DPGO dynamic pricing tool combines data collection and analysis with automation and AI-driven pricing recommendations to create the most advanced pricing tool on the market today!
We want you to be happy with your DPGO service, so we’re offering a free 30-day trial for all new sign-ups! Simply create your DPGO account, connect it to your Airbnb profile and watch as we optimize your pricing and revenue.
Get started with DPGO and sign up here!


Comments are closed.