
Airbnb analytics is one of the most critical weapons in any vacation rental host’s arsenal. As we head into a promising year of property investment, we wanted to outline some of the most essential Airbnb analytics to consider when investing in a new short-term rental property.
According to MatthewWoodward.co.uk, in 2022 Airbnb had 150 million worldwide users who have collectively booked over one billion stays. Airbnb operates in over 100,000 cities worldwide and six guests check into an Airbnb somewhere in the world every single second.
With Airbnb growing every day, it’s important to be able to take a step back and assess whether your investment property is performing or not. With the metrics we’ve listed below, you’ll be able to change how you operate and boost your performance.
According to the latest stats, the average Airbnb host earns $13,800 annually. This covers every rental type in every area across the globe. Airbnb’s current valuation is over $13 billion and it controls roughly 20% of the overall vacation rental industry.
It’s the new year and 2023 is going to be the year of vacation rental growth. If we were just starting out in the industry, we’d pay special attention to these metrics if we wanted to boost our success in 2023!
Which Airbnb Analytics Will Help Me the Most?
Below, we’ve rounded up a few analytics that we think are critical for the successful running of a vacation rental business. And by the way, all of these insights are available for free on Markets by DPGO. We love Airbnb data and we love being able to help fellow vacation rental hosts make their businesses a success.
The Area Map
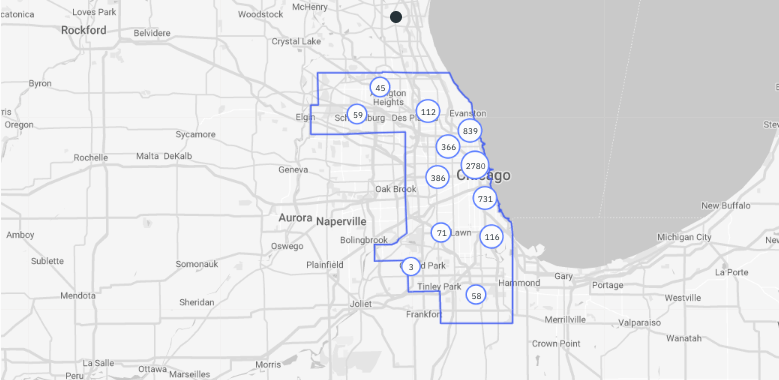
The area map is a powerhouse among Airbnb analytics tools, it offers a detailed view of Airbnb listings in your vicinity. The more Airbnb listings concentrated in one place, the more popular that area will be.
While we don’t always recommend buying where everyone else is, you should certainly be looking for Airbnb properties in areas that are popular with international tourists and local visitors. This tool is invaluable for both new and seasoned hosts. Here’s why:
The map displays the concentration of listings in specific areas
A higher concentration indicates a popular spot. Such areas are typically magnets for tourists, both international and local. This is key information for anyone in the short-term rental game.
While popularity is a plus, it’s not the sole factor to consider
Don’t rush to buy in crowded areas. Instead, use this tool to strike a balance. Look for Airbnb properties in sought-after areas but weigh other factors too.
Professional hosting tools like the area map leverage Airbnb data effectively
They provide insights into the profitable locations of Airbnb properties. This information is crucial for making informed decisions.
For example, understanding the distribution of listings can influence your pricing strategy. You can also gauge the potential for upcoming bookings. This, in turn, affects your monthly revenue and gross revenue projections.
The area map is among the best Airbnb analytics tools available. It gives you a bird’s eye view of short-term rental properties in your target area. Use it wisely to maximize your property’s potential and total revenue.
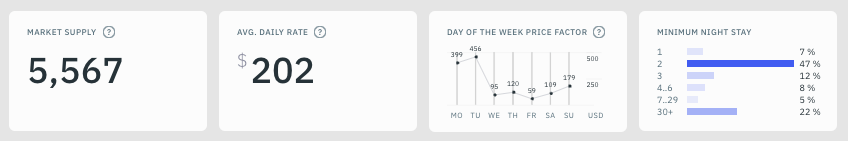
Market Supply
Market supply is a dynamic metric in Airbnb hosting. It represents the number of active vacation rentals in your target area. Keeping a close eye on this figure is crucial. Here’s why:
Market supply is never static
It shifts frequently, responding to various factors. Other hosts might pull their listings for renovations or personal use. They also adjust availability according to the season. Recognizing these patterns can give you a competitive edge.
A high market supply means more competition
To stand out, your listing must shine. Highlight unique features and provide excellent service. In contrast, a low market supply indicates less competition. This could be an opportunity to adjust your pricing strategy.
It helps you navigate the short-term rental landscape
It enables smarter pricing and marketing decisions. For example, during peak seasons, when supply drops, you might raise your prices.
Market supply is a vital metric for Airbnb hosts. It informs your strategy, helping you adapt to the market’s ebb and flow. Stay informed, stay agile, and optimize your listing accordingly. This approach ensures you maximize your property’s potential, regardless of market conditions.
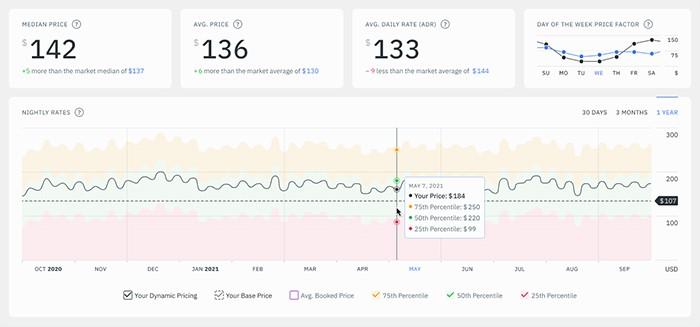
Average Daily Rate
The ADR (Average Daily Rate) stands central in rental analytics, it shows an average of how much the properties in your target area are charging per night. This is calculated by averaging prices from confirmed bookings in your target market over the next 30 days. The ADR changes often and can be radically different in different seasons.
Seasons greatly influence ADR. Summer might bring higher daily rates for vacation rentals. In contrast, urban areas could see a boost during events or conferences. Thus, understanding these patterns is key.
Use ADR to gauge your property’s standing in the market. A lower ADR could signal a need for improvement. Perhaps your listing or amenities require an upgrade. Conversely, a consistently high ADR indicates a well-positioned property. Additionally, analyze ADR in conjunction with other performance metrics. This helps in crafting a holistic pricing strategy. Ensure your property stays competitive without underselling it.
ADR requires vigilance and strategic thinking. Keep an eye on the Airbnb market data and adjust as necessary. Understand the seasonal shifts and plan accordingly. This approach ensures you stay ahead in the game and maximize your earnings.
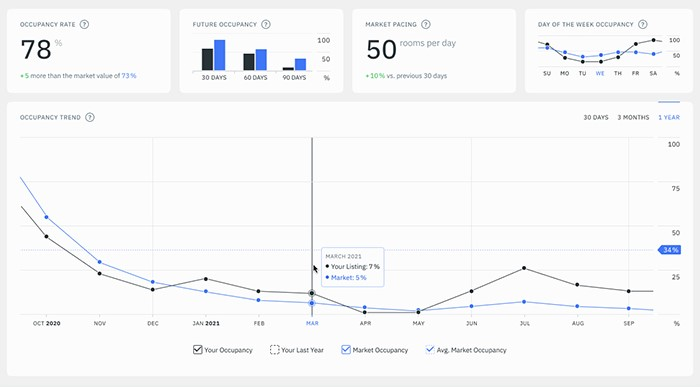
Occupancy Rate
Your occupancy rate is vital in the Airbnb market. It’s a clear indicator of the property’s performance and successful hosts monitor this rate closely. They compare it with other vacation rentals in their area. This comparison provides valuable insights.
To understand the short-term rental market better, use Airbnb market data. This data includes various performance metrics. The occupancy rate is one of the most significant among them, it helps in making informed decisions.
Furthermore, occupancy rate fluctuations can indicate market trends. High occupancy rates suggest your short-term rental listing is competitive. Low daily rates could mean it’s time for a change. Perhaps your pricing or amenities need adjustment.
Pay attention to seasonality trends as well. Certain times of the year may naturally have lower occupancy rates. Analyzing long-term trends is essential. It ensures your strategies are effective.
Mastering occupancy rates requires a combination of factors. Use Airbnb market data and other performance metrics to your advantage. Understand the short-term rental market and vacation rental landscape. This approach ensures sustained success and profitability.
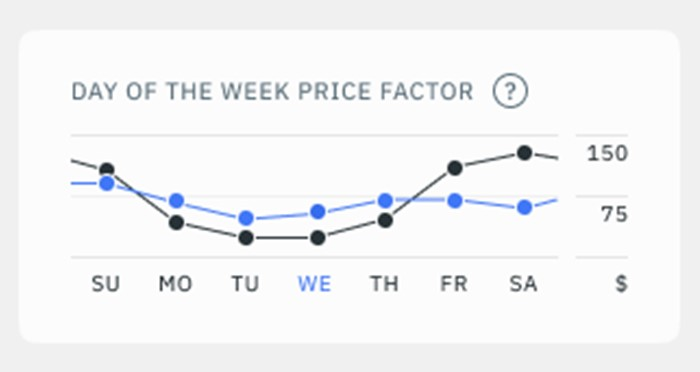
Day of the Week Price Factor
The day-of-the-week price factor is a game-changer. It’s a unique index, beloved by hosts and property managers alike. This tool sheds light on the nature of bookings in your target location.
This index is especially useful for understanding market behavior. Most markets, for instance, see a spike in demand for Friday and Saturday nights. This results in higher prices for those days. On the flip side, Tuesday and Wednesday nights are usually the cheapest.
Property managers find this tool invaluable. It assists in optimizing Airbnb listings for maximum revenue. With these insights, you can tweak your pricing and marketing strategies. The goal is to align your rates with market demand.
By analyzing Airbnb data, you understand your occupancy rate better. This, in turn, influences your property’s future performance. Knowledge of day-specific demand helps in anticipating booking patterns. This is crucial for maintaining a competitive edge.
For Airbnb listings looking to tap into market potential, this tool is a must. It enables smarter, data-driven decisions. Use it to refine your strategies and boost your property’s profitability.
Minimum Night Stay
The Minimum Night Stay index is really great in terms of Airbnb analytics because it shows two things at once. It can show you what the most popular minimum stay requirements are.
It can also give you insight into whether or not there are government-enforced minimum stay requirements. If the market has “30+ days” as the most popular stay requirement, then it could mean short-term rentals are prohibited in the area.
Being aware of this is essential for operating within the law. This index helps you align your property with market expectations. If most listings require a two-night minimum, consider adopting this standard.


Comments are closed.